30th Anniversary of NPA
Now and Then
In celebration of our 30th anniversary, NPA is running a "Now and Then" campaign, comparing information about the association between today and three decades ago.
PACE Growth


THEN: On Lok Senior Services and 10 PACE Demonstration Programs in 8 States
NOW: 163 PACE Organizations in 32 States and the District of Columbia
In 1994 PACE was still on its way to becoming a Permanent Provider Type under Medicare and Medicaid. On Lok, in San Francisco, CA, developed the PACE model of care and advocated for the Centers for Medicare & Medicaid Services (CMS), which was then known as the Health Care Financing Administration, to test the effectiveness of the model by allowing PACE demonstration programs around the country. The PACE demonstrations would follow the PACE protocol developed by On Lok, collect data, and test the model in different communities and with different sponsor types.
Congress passed legislation making PACE a permanent provider type under Medicare and Medicaid as part of the Balanced Budget Act of 1999. The first PACE demonstration program was approved as a PACE provider in November 2001.
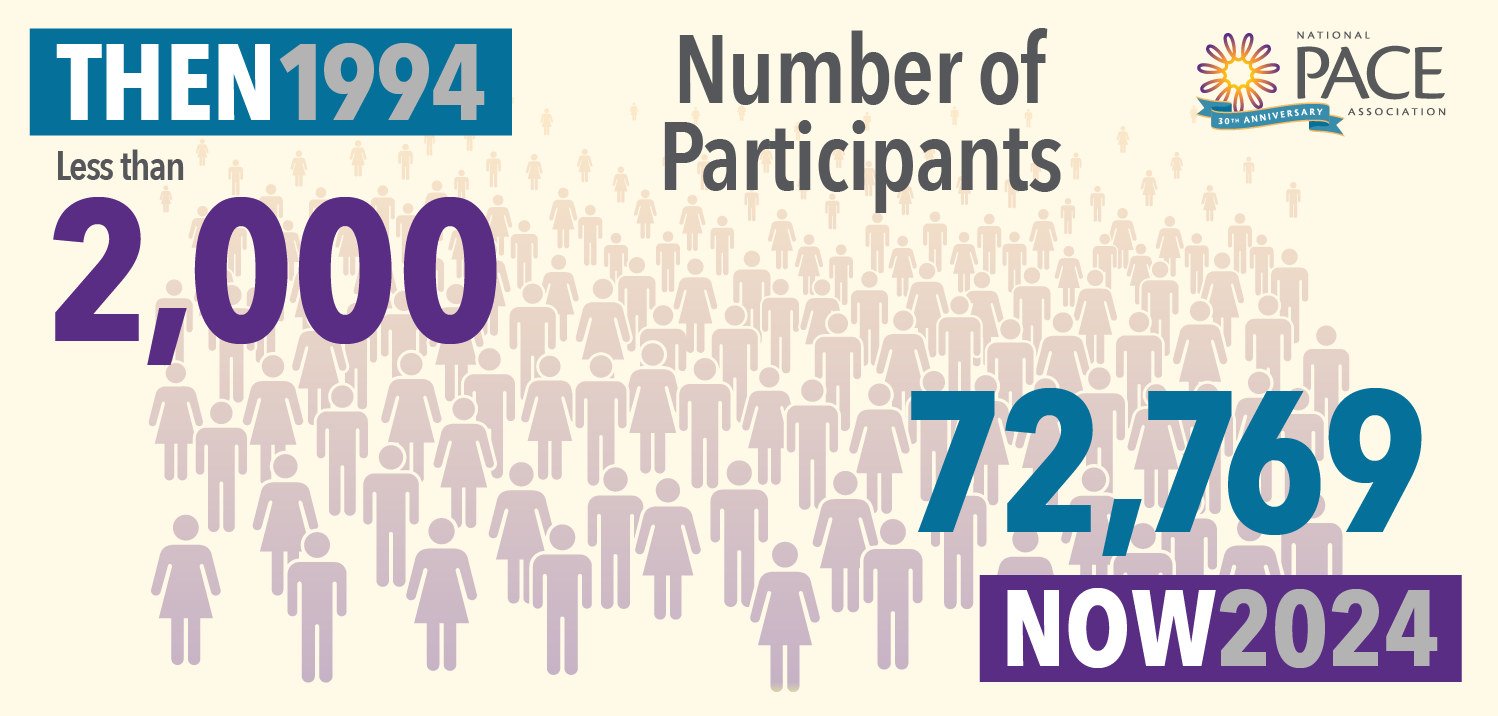
Today, PACE is growing rapidly, with 163 PACE organizations operating more than 300 PACE centers in 32 states and District of Columbia and serving over 72,000 participants.
People Served
Coast-to-Coast Coverage

Data

Number of States

Number of Full-Time Employees

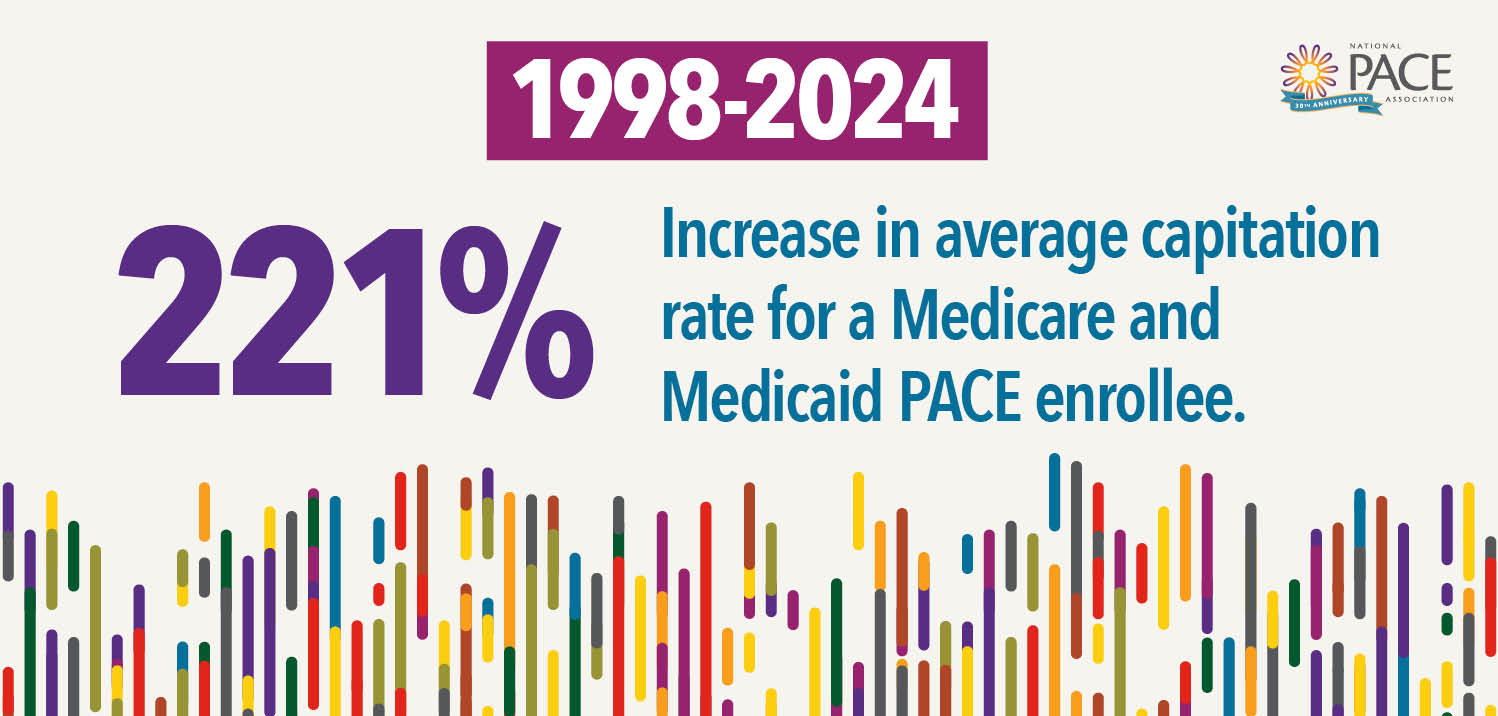
Increase in Average Capitation Rate
For 30 years NPA has worked to ensure PACE organizations have the regulatory and payment environment that makes it possible to provide person-centered care to each participant and their family.
For More Information
Contact Member Services